インフォグラフィック 推奨:ChatGPT
サイエンス図表:一晩の安眠マップ
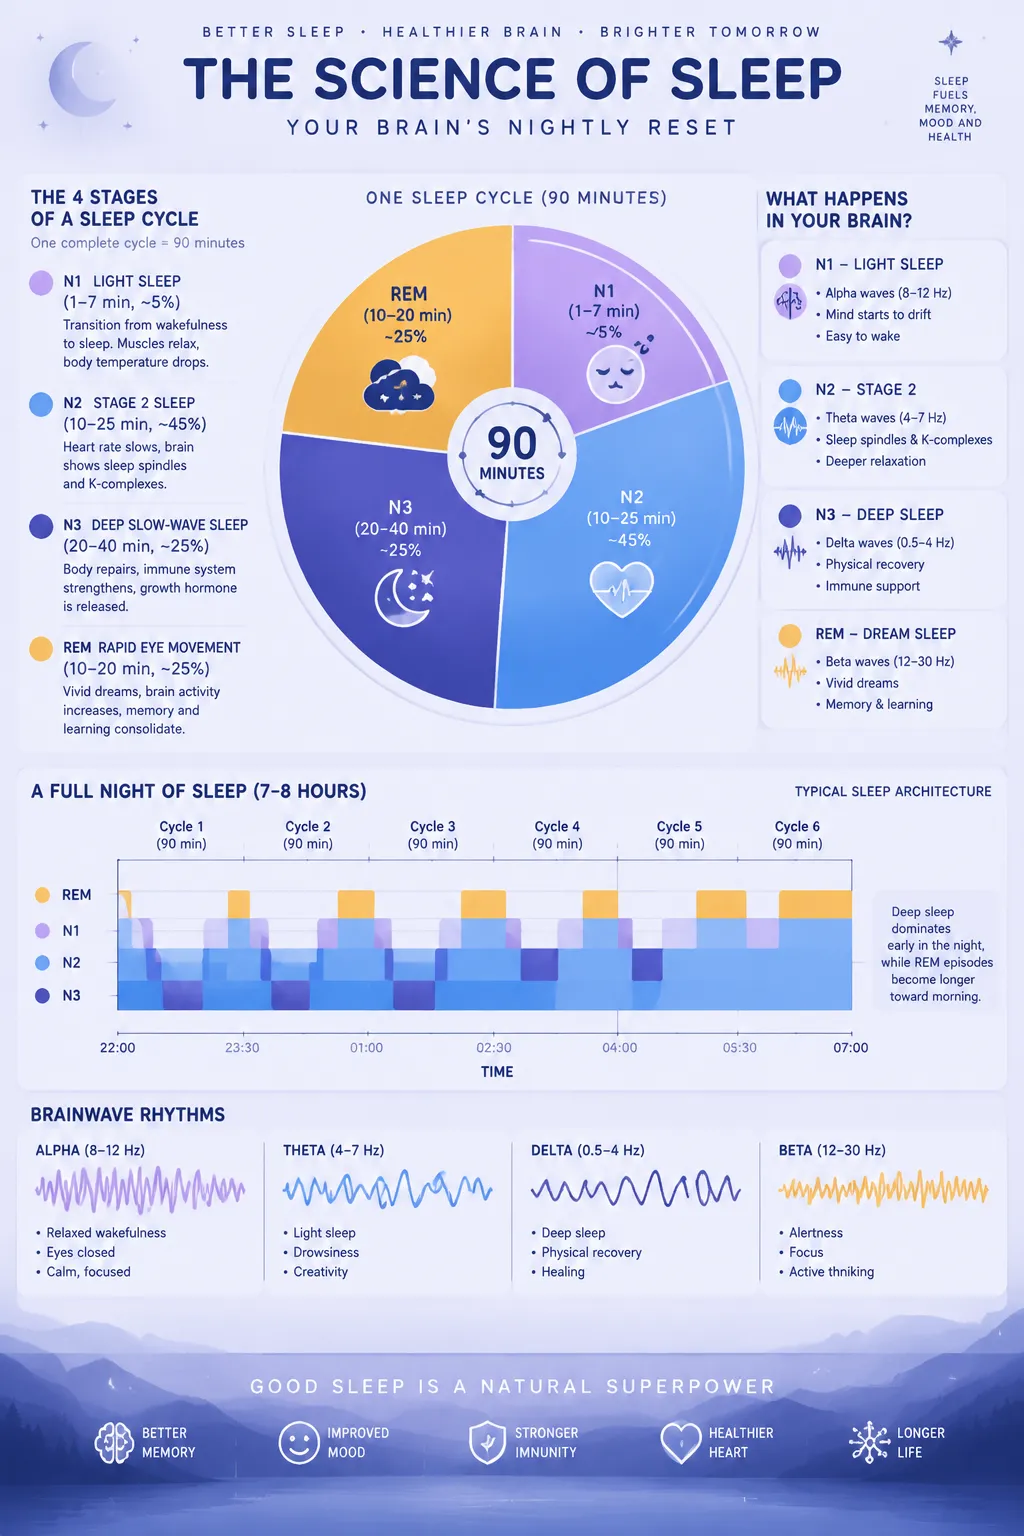
大円が 90 分の睡眠周期の四段階を解き明かす。下の折れ線グラフは一晩を通じて深い眠りが前へ移り REM が長くなるリズムを示し、αからδまでの脳波の波形を添える。
プロンプト全文(英語)
Scientific infographic poster explaining human sleep cycles and brain-wave stages, front-view flat presentation. Layout: a large circular cycle diagram at the center showing one 90-minute sleep cycle divided into four colored segments: stage N1 light sleep, stage N2, stage N3 deep slow-wave sleep, and REM sleep, with small flat icons for the drowsy face, heart monitor, moon and dreaming cloud. A horizontal line chart beneath the circle plots a full night of 7-8 hours across five to six consecutive cycles, showing how deep sleep dominates early hours and REM episodes lengthen toward morning, with annotated brain-wave waveform strips for alpha, theta, delta and beta rhythms. Color system: calming indigo (#312E81), soft lavender (#A78BFA), dusk blue (#60A5FA) and warm peach (#FBBF24) for the REM accent on a pale night-sky background (#F5F3FF). Typography: rounded sans-serif title, clear stage labels, thin waveform captions. Background: subtle star-specks and soft moonlit gradient. Data feel: sleep-lab clinical chart with time axis and stage banding. Lighting: soft ambient night glow, gentle shadows, luminous accents. 4k
同じ画像を生成:
上のプロンプトをコピー → ChatGPTを開く → 貼り付けて送信(画像モデルは切り替え可) → 結果を待つ。
ChatGPTを開く ↗
詳しい手順は
チュートリアルへ。
よくある質問
この画像はどう再現するの?▾
上の英語プロンプトをコピーし、ChatGPTを開いて画像モデルに切り替え、プロンプトを貼り付けて送信します。モデルが似た結果を生成します。
どのAIツールを使えばいい?▾
推奨:ChatGPT。長い英語プロンプトを受け付ける対話型画像ツールなら、どれでも似た結果を出せます。
このプロンプトをカスタマイズできる?▾
はい。被写体、スタイル、色、構図の指定を自分のものに差し替えられます。説明文には通常、変更箇所のヒント(例:「XをYに置き換え」)があります。
実例画像は自由に使えますか?▾
実例画像は当サイトがこのプロンプトで紹介用に生成したものです。プロンプト自体は自由にコピー・利用できます。商用利用の場合は、使用するAIツールの条件をご確認ください。