インフォグラフィック 推奨:ChatGPT
サイエンス図表:カフェインの代謝の旅
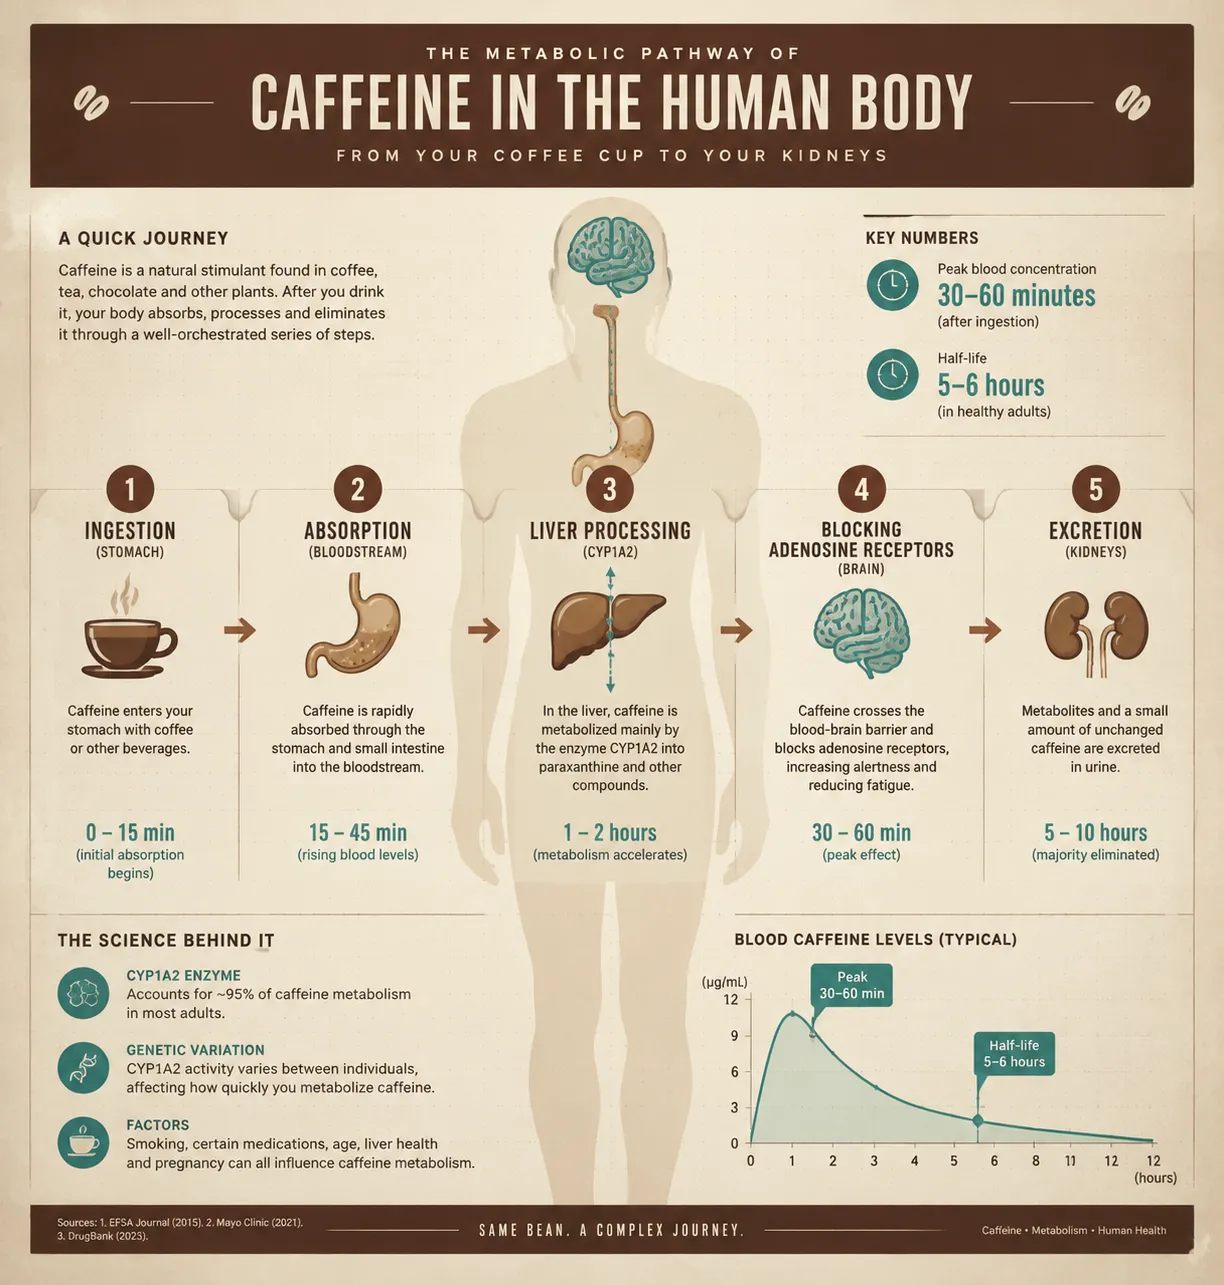
クリーム色の人体シルエットの中に五段階の代謝矢印。胃での吸収から肝臓の CYP1A2 酵素による分解、脳内のアデノシン受容体のブロックまで、ピーク時間と半減期を記す。
プロンプト全文(英語)
Scientific infographic poster explaining the metabolic pathway of caffeine inside the human body, front-view flat presentation. Layout: a centered cream-colored human silhouette in minimal flat style, with a clear five-stage horizontal flowchart arrow flowing left to right across the torso, from ingestion in the stomach, absorption into the bloodstream, liver processing through the CYP1A2 enzyme, blocking adenosine receptors in the brain, to final excretion through the kidneys. Each stage has a numbered circular badge, elapsed-time labels in hours (peak blood concentration 30-60 minutes, half-life 5-6 hours) and small flat icons for the coffee cup, stomach, liver, brain and kidneys. Color system: warm coffee browns (#5C3A21, #8B5A2B) on a cream background (#F5EFE6) with teal highlights (#2A9D8F) for data points and a deep espresso header (#3E2723). Typography: bold condensed sans-serif title, medium sub-labels, thin data captions with clear hierarchy. Background: subtle fine-dot grid texture with a soft parchment vignette. Data feel: rigorous laboratory poster with tick marks and a footnote bar. Lighting: soft diffused studio light from the upper left, gentle drop shadows under badges, matte paper finish. 4k
同じ画像を生成:
上のプロンプトをコピー → ChatGPTを開く → 貼り付けて送信(画像モデルは切り替え可) → 結果を待つ。
ChatGPTを開く ↗
詳しい手順は
チュートリアルへ。
よくある質問
この画像はどう再現するの?▾
上の英語プロンプトをコピーし、ChatGPTを開いて画像モデルに切り替え、プロンプトを貼り付けて送信します。モデルが似た結果を生成します。
どのAIツールを使えばいい?▾
推奨:ChatGPT。長い英語プロンプトを受け付ける対話型画像ツールなら、どれでも似た結果を出せます。
このプロンプトをカスタマイズできる?▾
はい。被写体、スタイル、色、構図の指定を自分のものに差し替えられます。説明文には通常、変更箇所のヒント(例:「XをYに置き換え」)があります。
実例画像は自由に使えますか?▾
実例画像は当サイトがこのプロンプトで紹介用に生成したものです。プロンプト自体は自由にコピー・利用できます。商用利用の場合は、使用するAIツールの条件をご確認ください。