インフォグラフィック 推奨:ChatGPT
サイエンス図表:プレートと震源帯の図
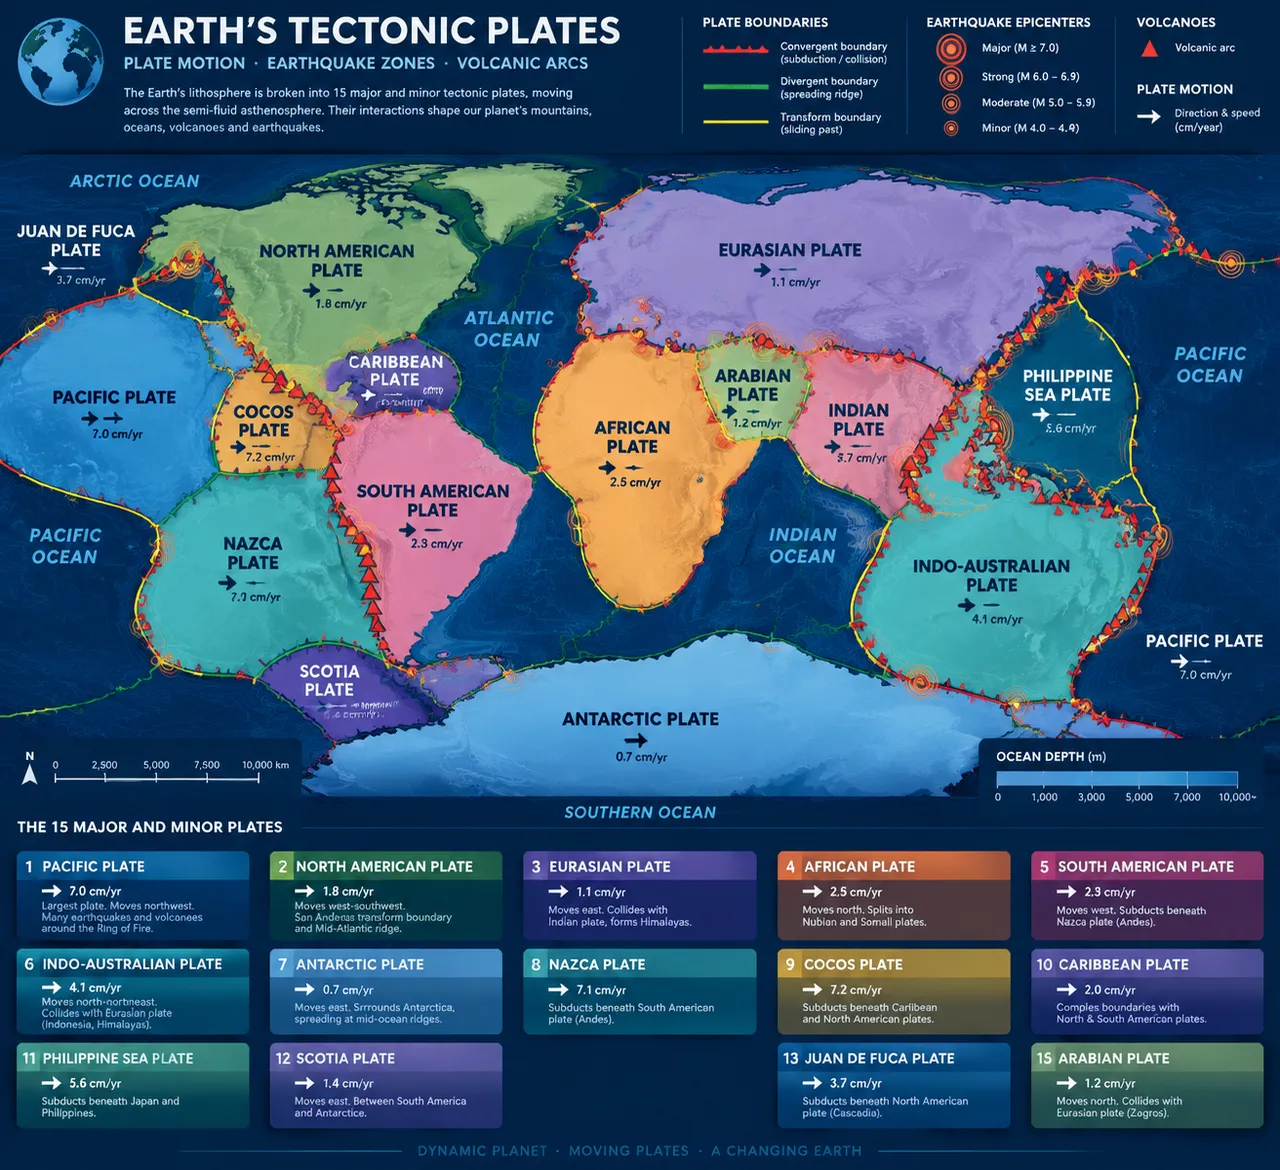
十五の大プレートが色面で世界地図を埋める。紅・緑・黄の三色の境界線が収束・発散・すれ違い帯を区別し、同心円が震源のホットスポットと火山弧を記す。
プロンプト全文(英語)
Scientific infographic poster of Earth's tectonic plates and major earthquake zones, front-view flat presentation. Layout: a large world map centered on the poster with the fifteen major and minor plates drawn as distinct color regions, including the Pacific, North American, Eurasian, African, South American, Indo-Australian and Antarctic plates, each labeled in bold capitals with a small plate-motion arrow showing drift direction and speed in centimeters per year. Convergent boundaries drawn as thick red lines with triangular markers, divergent boundaries as green double lines, and transform boundaries as thin yellow lines. Earthquake epicenter hotspots shown as concentric circle icons of increasing size, and volcanic arcs as small triangle icons. Color system: soft pastel plate fills (blue, green, orange, pink, purple, teal) on an ocean-navy base (#12355B) with boundary colors red, green and yellow. Typography: clean geoscience sans-serif labels. Background: subtle depth-contour texture. Data feel: geophysics atlas chart with plate-name banners and boundary legend. Lighting: even cartographic light, faint inner glow on hotspots, crisp lines. 4k
同じ画像を生成:
上のプロンプトをコピー → ChatGPTを開く → 貼り付けて送信(画像モデルは切り替え可) → 結果を待つ。
ChatGPTを開く ↗
詳しい手順は
チュートリアルへ。
よくある質問
この画像はどう再現するの?▾
上の英語プロンプトをコピーし、ChatGPTを開いて画像モデルに切り替え、プロンプトを貼り付けて送信します。モデルが似た結果を生成します。
どのAIツールを使えばいい?▾
推奨:ChatGPT。長い英語プロンプトを受け付ける対話型画像ツールなら、どれでも似た結果を出せます。
このプロンプトをカスタマイズできる?▾
はい。被写体、スタイル、色、構図の指定を自分のものに差し替えられます。説明文には通常、変更箇所のヒント(例:「XをYに置き換え」)があります。
実例画像は自由に使えますか?▾
実例画像は当サイトがこのプロンプトで紹介用に生成したものです。プロンプト自体は自由にコピー・利用できます。商用利用の場合は、使用するAIツールの条件をご確認ください。