Infographic Recommended: ChatGPT
Infographic: Brand Annual Data Poster
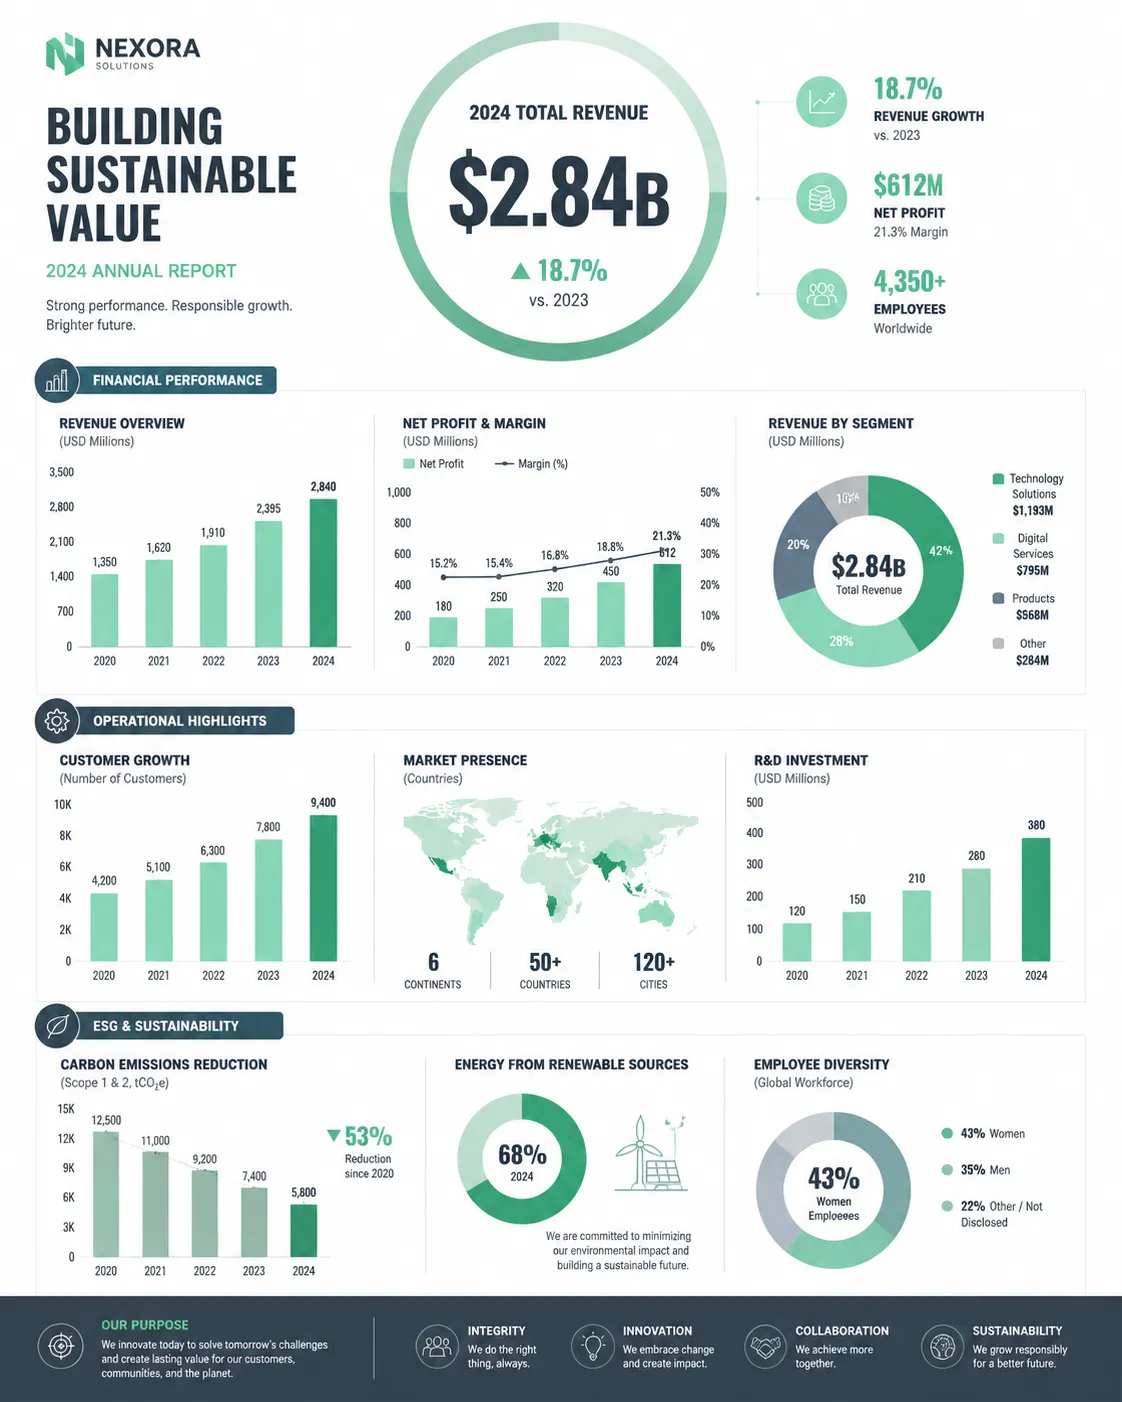
A brand annual-report infographic: a ringed hero number, bar/donut charts, and grid layout — for reports, white papers, and social media graphics.
Full prompt (English)
Clean corporate infographic poster visualizing a brand's annual report: bold headline number in a large circular chart at top, three rows of aligned bar and donut charts with a consistent mint-and-slate palette, thin connecting lines and labeled axes, small icon glyphs, generous white space, professional editorial layout on a 12-column grid, flat design with subtle depth, crisp typography hierarchy, print-ready quality, 4k
Recreate this:
Copy the prompt above → open ChatGPT → paste and send (you can switch the image model) → wait for the result.
Open ChatGPT ↗
For step-by-step details, see the
tutorial.
FAQ
How do I recreate this image?▾
Copy the English prompt above, open ChatGPT, switch to an image model, paste the prompt and send — the model will generate the same look.
Which AI tool should I use?▾
Recommended target: ChatGPT. Any conversational image tool that supports long English prompts can reproduce an approximate result.
Can I customize this prompt?▾
Yes — swap the subject, style, colors or composition words with your own. The description often points out typical swap points (e.g. “swap X for Y”).
Can I use the sample image freely?▾
The sample image was generated by us with this prompt for display only; the prompt itself is free to copy and use. For commercial use, follow the terms of your chosen AI tool.