インフォグラフィック 推奨:ChatGPT
サイエンス図表:渡り鳥のフライウェイ
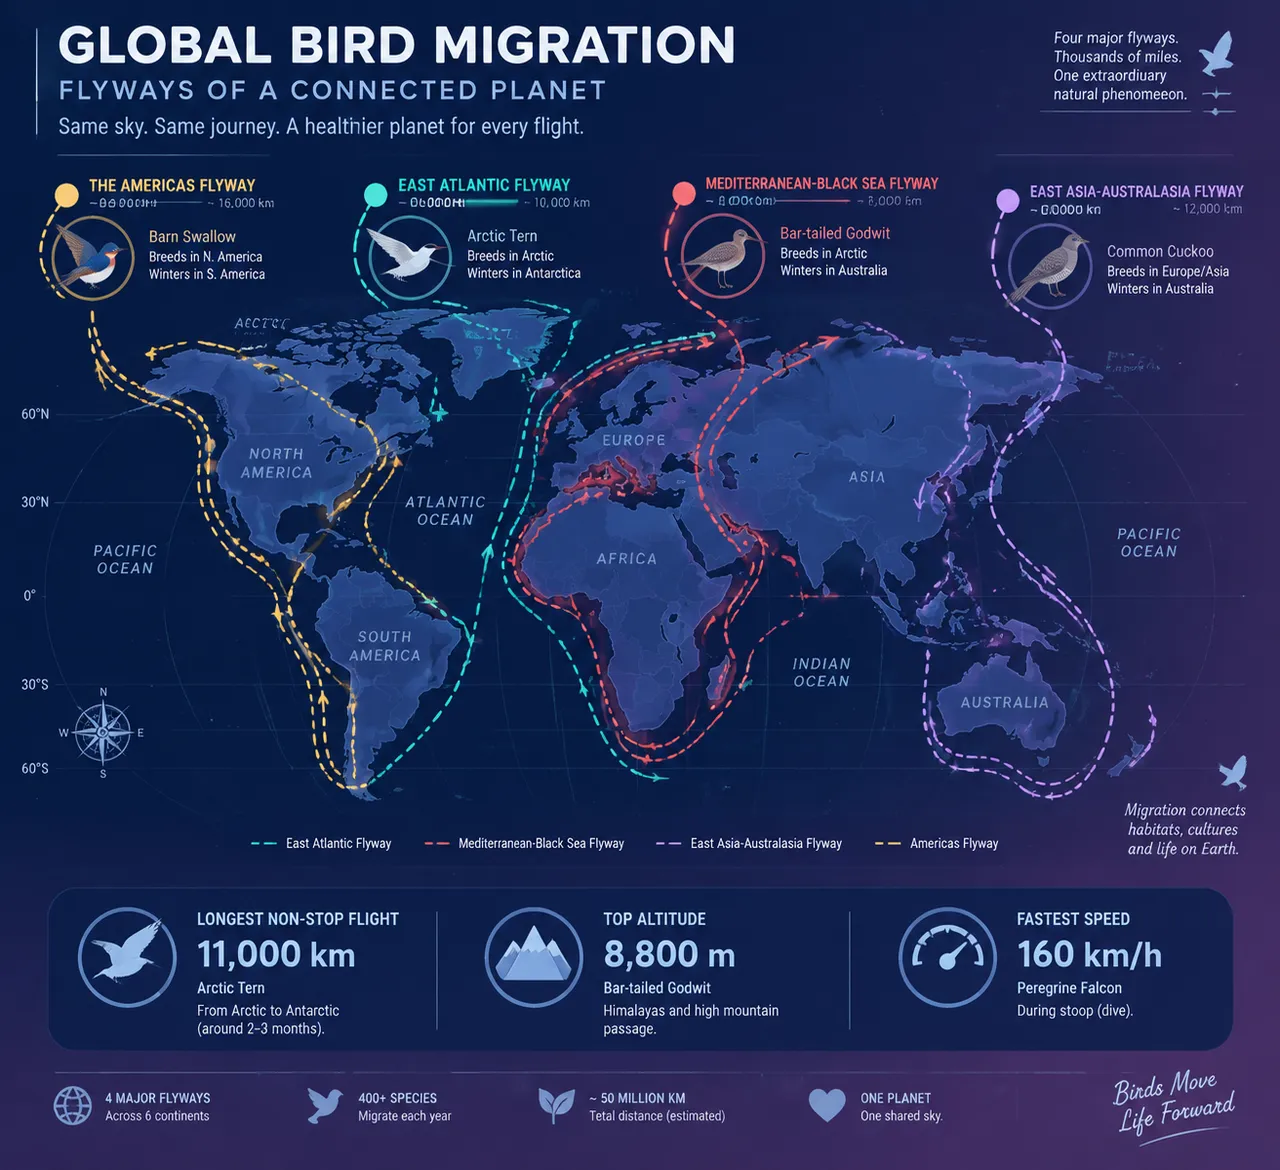
深い藍色の世界地図に四大回遊ルートを描く。色とりどりの点線と記録カードを配し、キョクエンの 11,000 キロノンストップ飛行を注記する。月夜のムード。
プロンプト全文(英語)
Infographic poster mapping global bird migration flyways, front-view flat presentation. Layout: a large world map in deep dusk-navy tones centered on the poster, with four major flyway corridors drawn as elegant curved dashed lines: the East Atlantic, Mediterranean-Black Sea, East Asia-Australasia and Americas flyways, each in a distinct color, annotated with species icons for the Arctic tern, bar-tailed godwit, common cuckoo and barn swallow. Small circular callout panels show three record-breaker data cards: longest non-stop flight of 11,000 km, top altitude of 8,800 meters and fastest speed of 160 km/h, each with a flat icon and bold numbers. Color system: dusk gradient background from deep indigo (#1A2744) to soft violet (#4C3B6B), flyway lines in teal (#2EC4B6), coral (#FF6F59), gold (#F9C74F) and lavender (#B39DDB), with white labels. Typography: clean modern sans-serif, bold record numbers. Background: subtle latitude-longitude grid with faint star specks. Data feel: ornithology atlas with route distance labels in kilometers. Lighting: soft moonlit ambience, glowing route lines, gentle map shading. 4k
同じ画像を生成:
上のプロンプトをコピー → ChatGPTを開く → 貼り付けて送信(画像モデルは切り替え可) → 結果を待つ。
ChatGPTを開く ↗
詳しい手順は
チュートリアルへ。
よくある質問
この画像はどう再現するの?▾
上の英語プロンプトをコピーし、ChatGPTを開いて画像モデルに切り替え、プロンプトを貼り付けて送信します。モデルが似た結果を生成します。
どのAIツールを使えばいい?▾
推奨:ChatGPT。長い英語プロンプトを受け付ける対話型画像ツールなら、どれでも似た結果を出せます。
このプロンプトをカスタマイズできる?▾
はい。被写体、スタイル、色、構図の指定を自分のものに差し替えられます。説明文には通常、変更箇所のヒント(例:「XをYに置き換え」)があります。
実例画像は自由に使えますか?▾
実例画像は当サイトがこのプロンプトで紹介用に生成したものです。プロンプト自体は自由にコピー・利用できます。商用利用の場合は、使用するAIツールの条件をご確認ください。