인포그래픽 추천 대상: ChatGPT
과학 인포그래픽: 판 구조와 지진대 지도
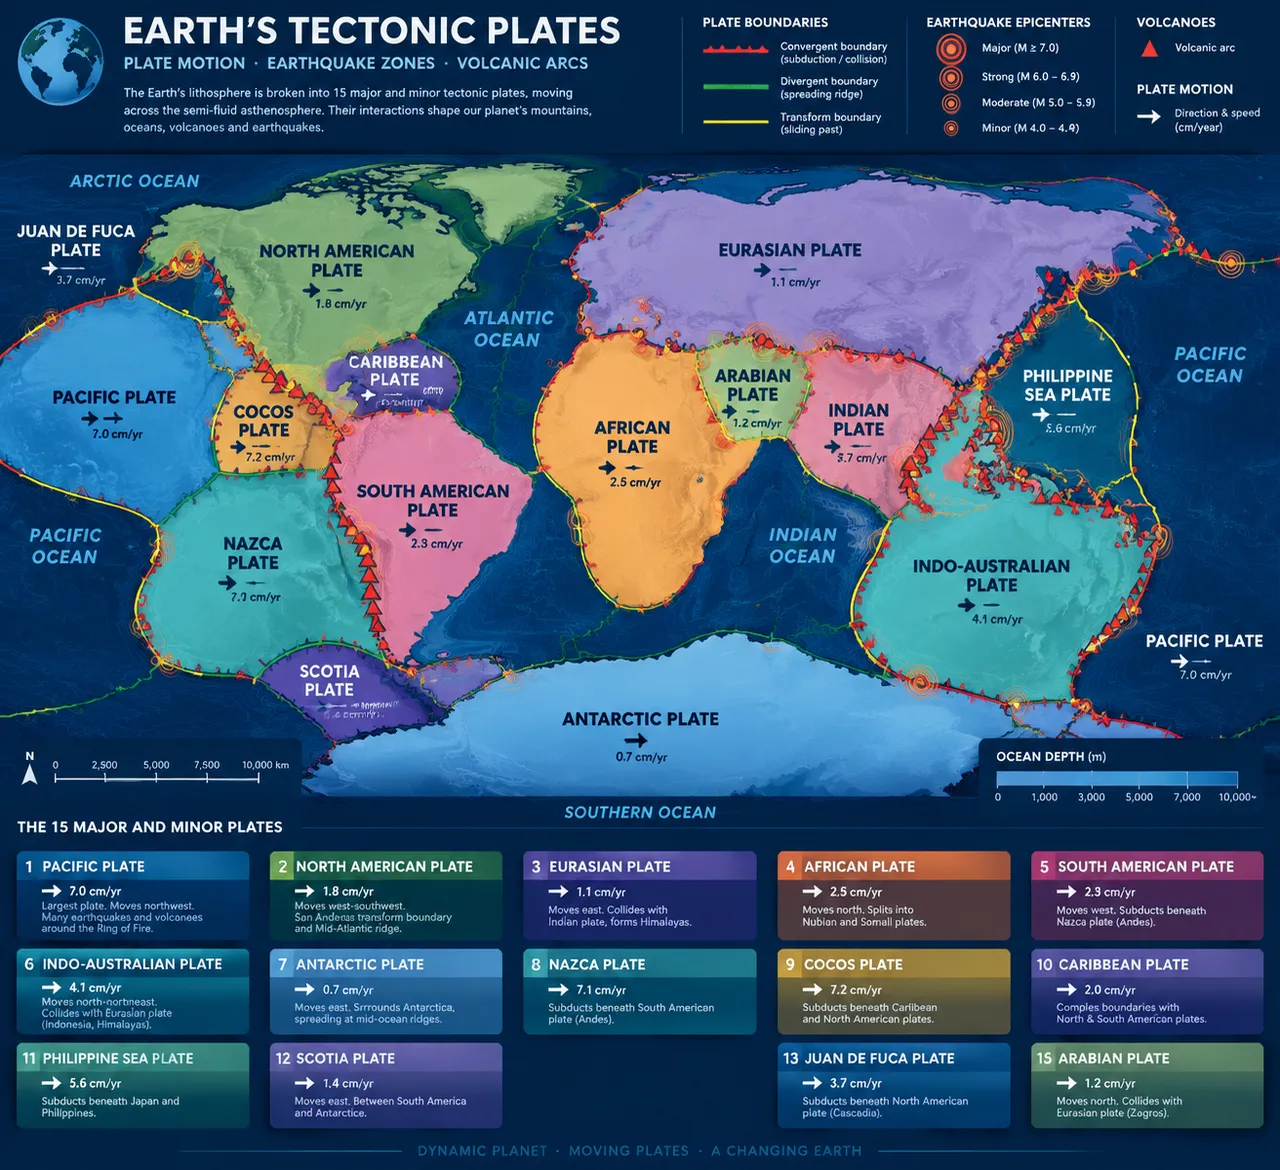
열다섯 개 판이 색 블록으로 세계 지도를 채우고, 빨강·초록·노랑 경계선이 수렴형과 발산형, 보존형 경계를 구분해요. 동심원으로 진원지 핫스팟과 화산호가 표시돼요.
전체 프롬프트 (영문)
Scientific infographic poster of Earth's tectonic plates and major earthquake zones, front-view flat presentation. Layout: a large world map centered on the poster with the fifteen major and minor plates drawn as distinct color regions, including the Pacific, North American, Eurasian, African, South American, Indo-Australian and Antarctic plates, each labeled in bold capitals with a small plate-motion arrow showing drift direction and speed in centimeters per year. Convergent boundaries drawn as thick red lines with triangular markers, divergent boundaries as green double lines, and transform boundaries as thin yellow lines. Earthquake epicenter hotspots shown as concentric circle icons of increasing size, and volcanic arcs as small triangle icons. Color system: soft pastel plate fills (blue, green, orange, pink, purple, teal) on an ocean-navy base (#12355B) with boundary colors red, green and yellow. Typography: clean geoscience sans-serif labels. Background: subtle depth-contour texture. Data feel: geophysics atlas chart with plate-name banners and boundary legend. Lighting: even cartographic light, faint inner glow on hotspots, crisp lines. 4k
같은 이미지 만들기:
위 프롬프트를 복사 → ChatGPT 열기 → 붙여넣고 전송(이미지 모델로 전환할 수 있어요) → 결과를 기다리면 돼요.
ChatGPT 열기 ↗
자세한 사용법은
튜토리얼을 참고하세요.
자주 묻는 질문
이 이미지는 어떻게 따라 만들 수 있나요?▾
위의 영문 프롬프트를 복사한 뒤 ChatGPT을(를) 열고 이미지 모델로 전환해 붙여넣고 전송하면, 모델이 비슷한 결과를 만들어 줘요.
어떤 AI 도구를 사용해야 하나요?▾
추천 대상: ChatGPT. 긴 영문 프롬프트를 지원하는 대화형 이미지 생성 도구라면 비슷한 결과를 얻을 수 있어요.
이 프롬프트를 내 입맛대로 바꿀 수 있나요?▾
네, 가능해요. 주제·스타일·색상·구성 단어를 원하는 주제로 바꾸면 돼요. 설명에는 보통 바꿀 수 있는 대표적인 지점(예: swap X for Y)이 안내되어 있어요.
예시 이미지를 자유롭게 사용할 수 있나요?▾
예시 이미지는 본 사이트가 이 프롬프트로 생성한 전시용 이미지예요. 프롬프트 본문은 자유롭게 복사해 사용할 수 있고, 상업적 이용 시에는 사용하는 AI 도구의 약관을 따라 주세요.